

Industry Dashboards
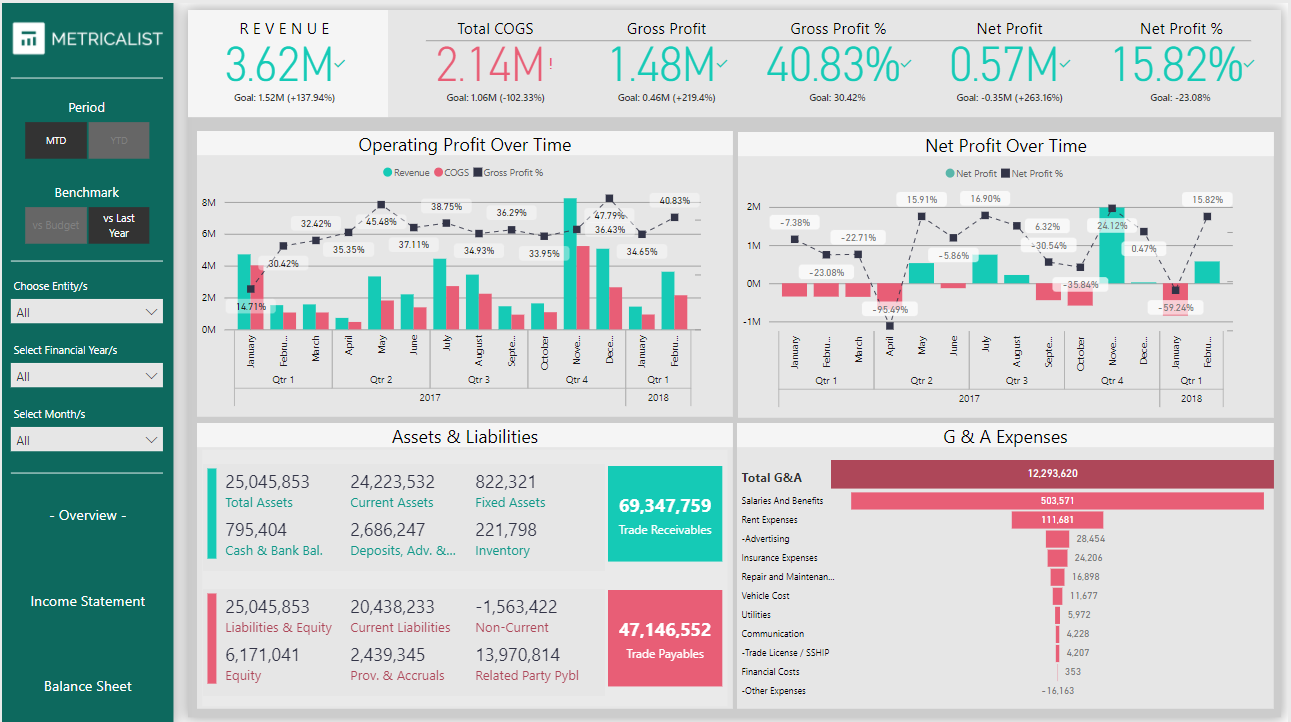
Financial Performance
Performance overview and interactive financial statements with custom filtering
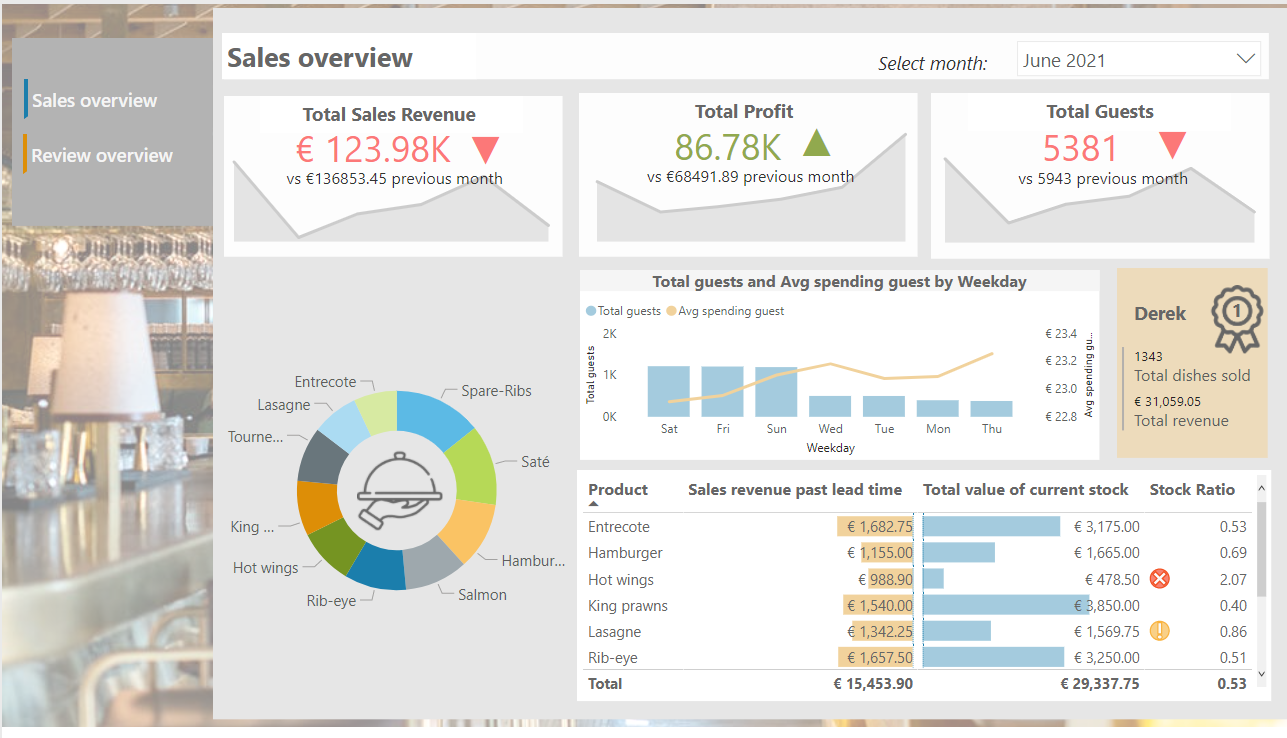
Bar and Restaurant Performance
Provides an overview of both product sales and customer review performance
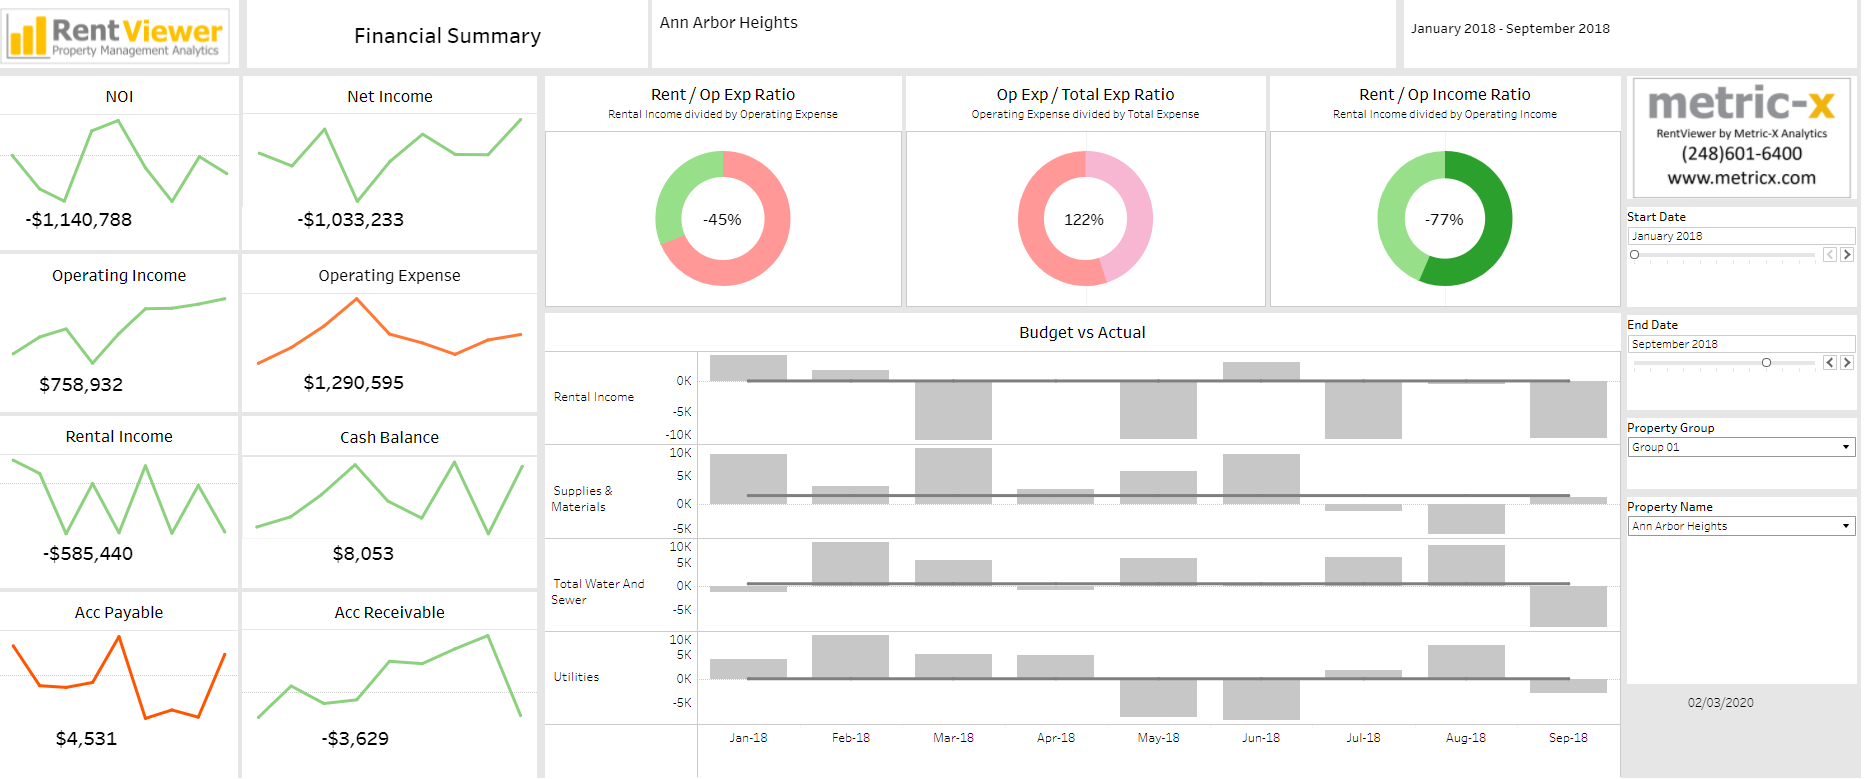
Property Management
Shows the financial health of property groups and the performance of select properties
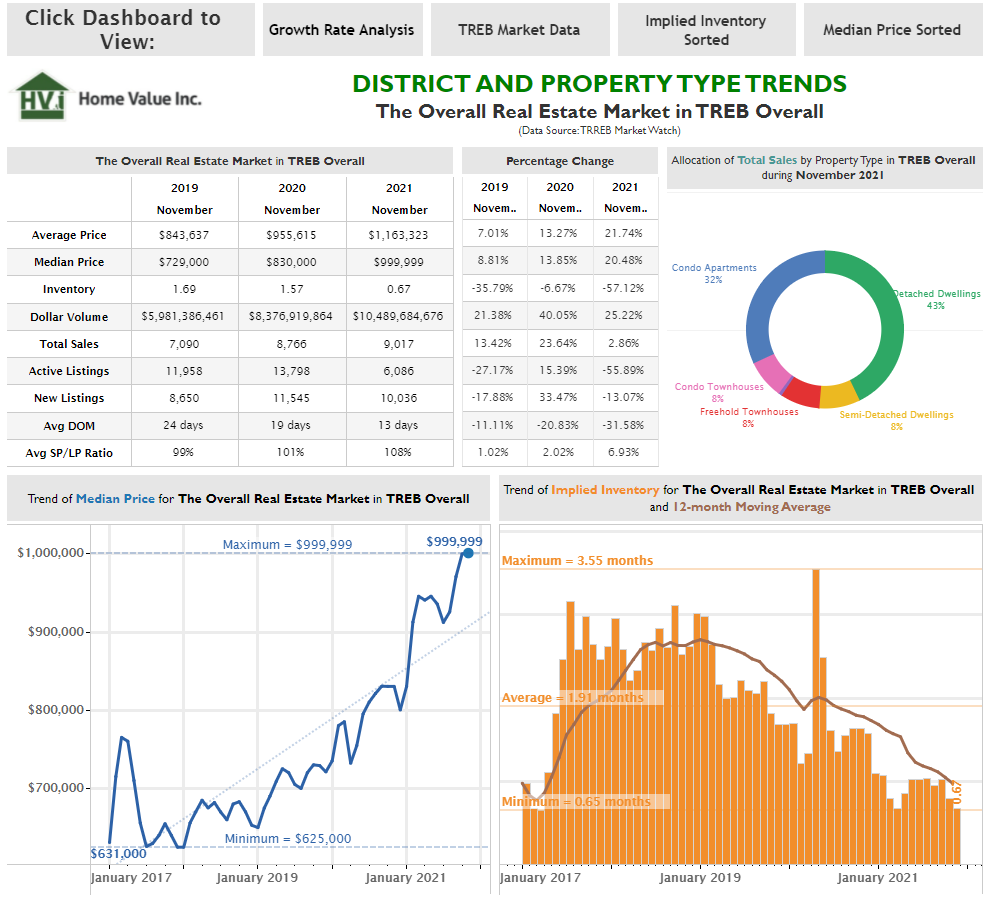
Real Estate Trends
District and property type trends across a select real estate market
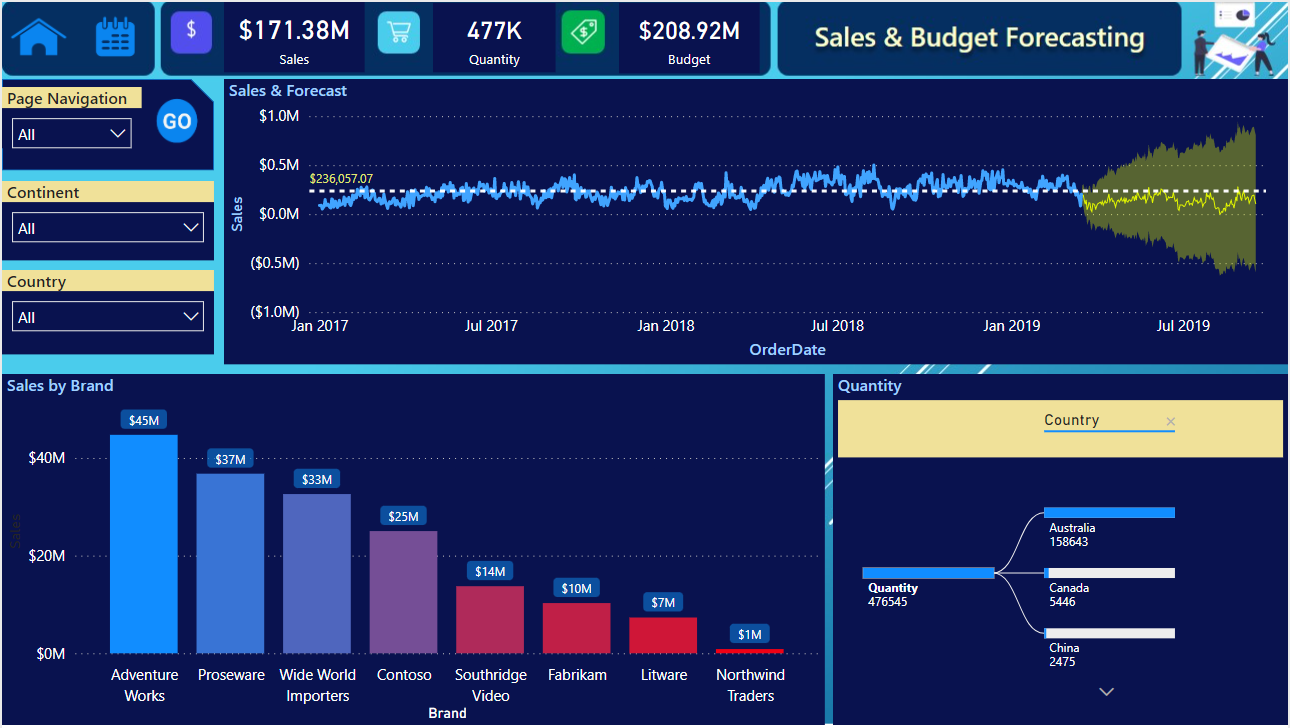
Sales and Budget Forecasting
Sales performance against budget and forecasted sales by brand and country
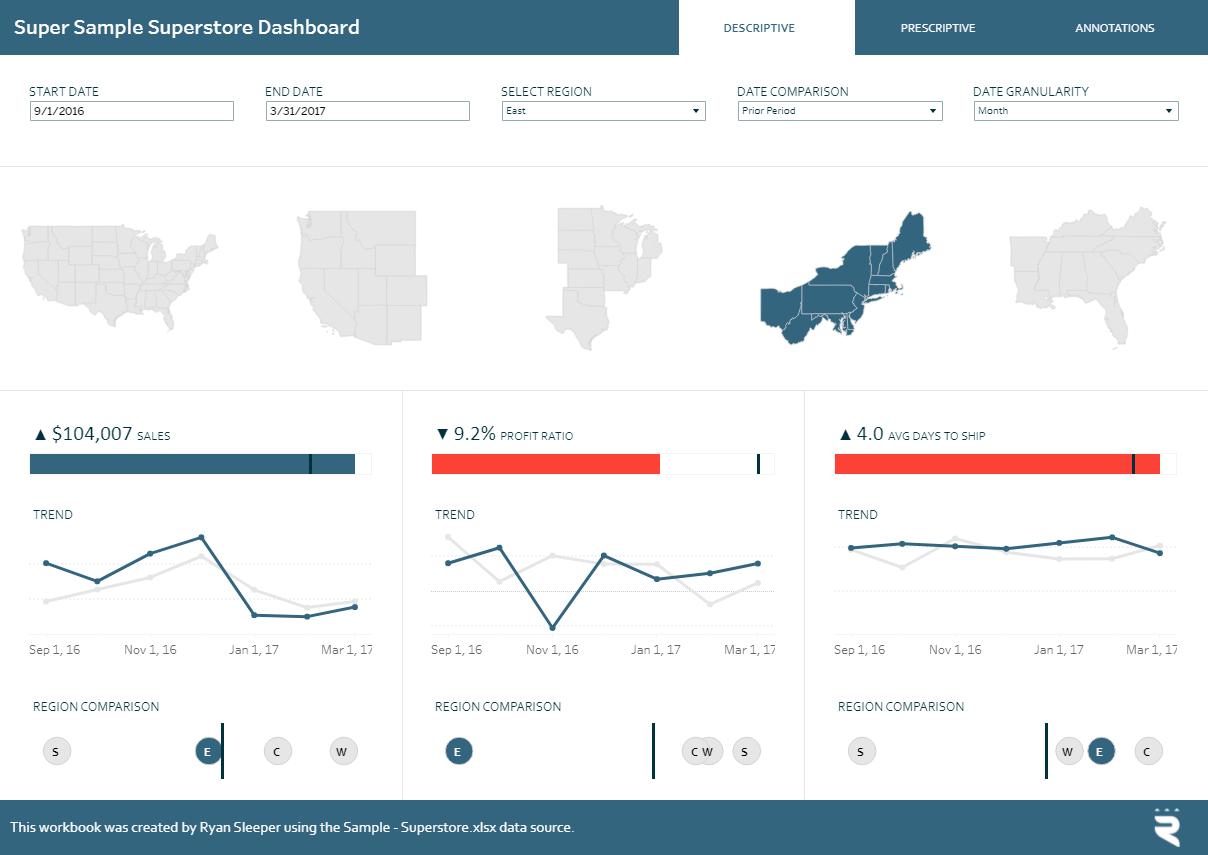
Family Office Operations
Descriptive and predictive analytics for office operations and sales performance

User Dashboards
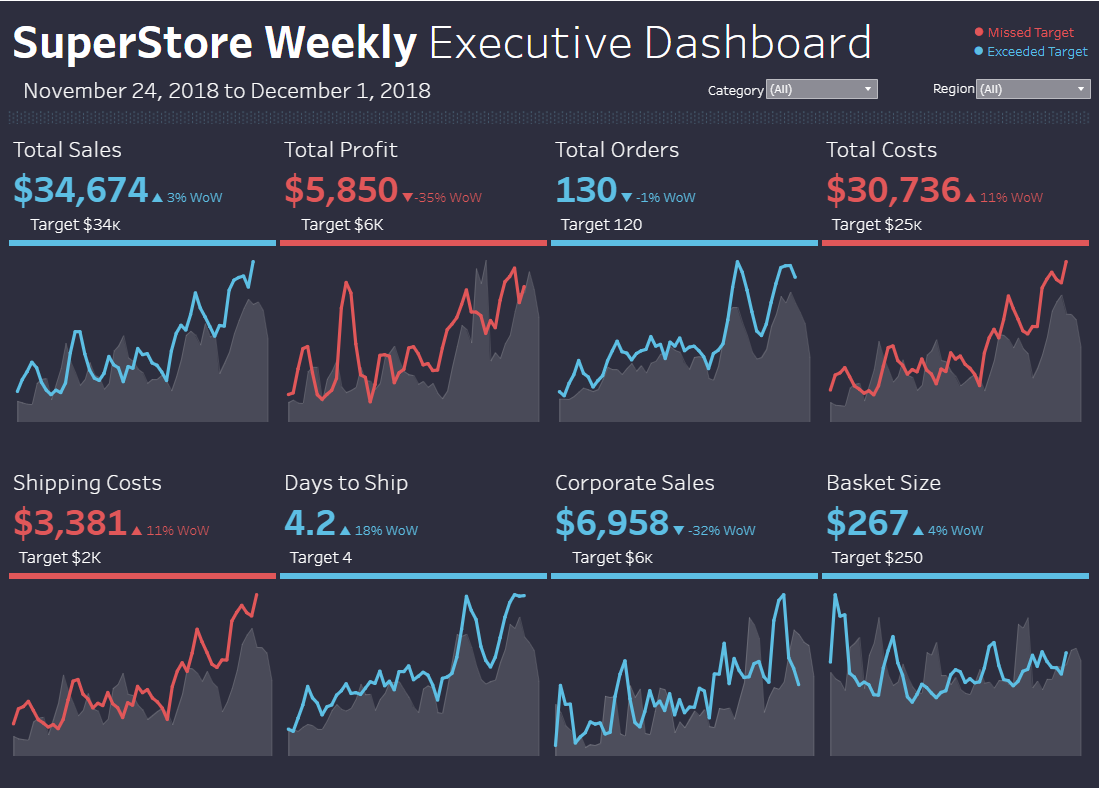
Executive Overview
Straightforward and effective high-level executive overview with clear key performance indicators
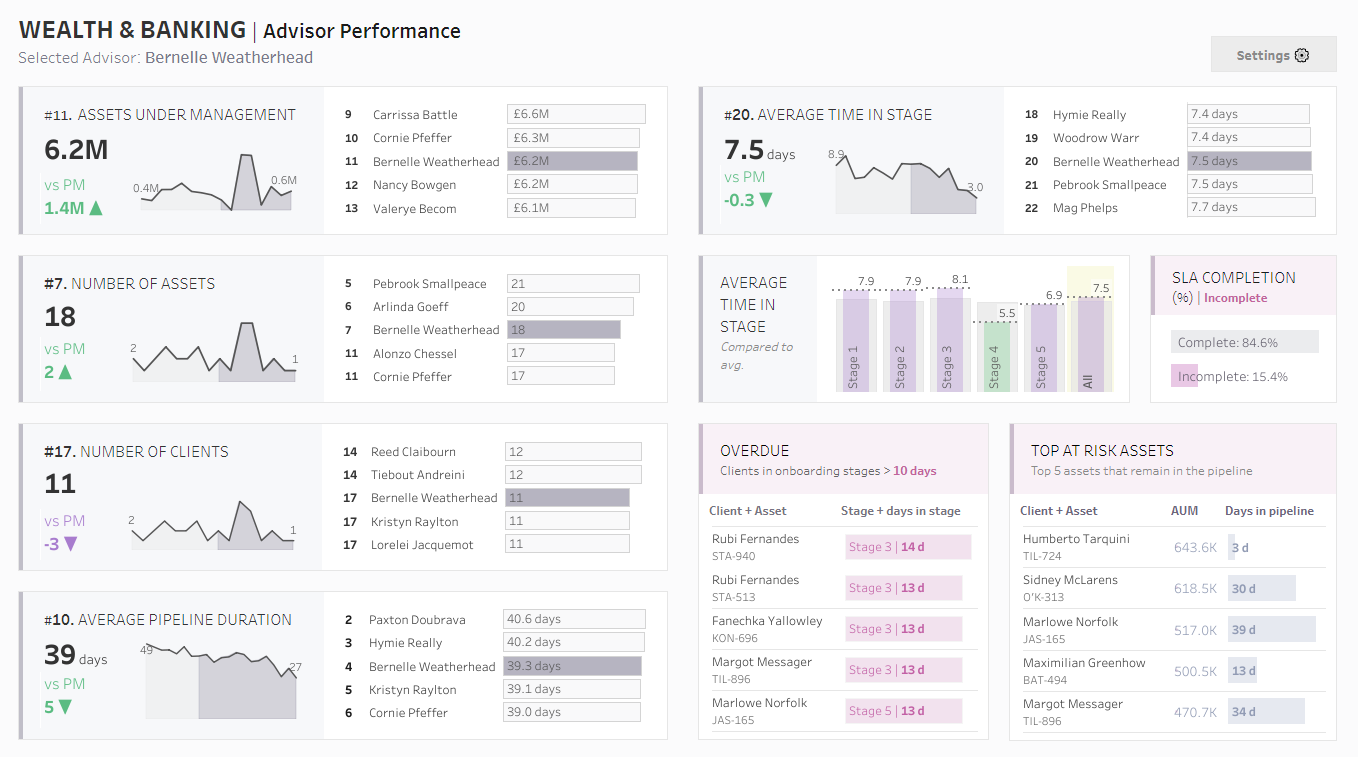
Manager Review
Detailed review of key metrics, benchmarks, and rankings that provide actionable insights
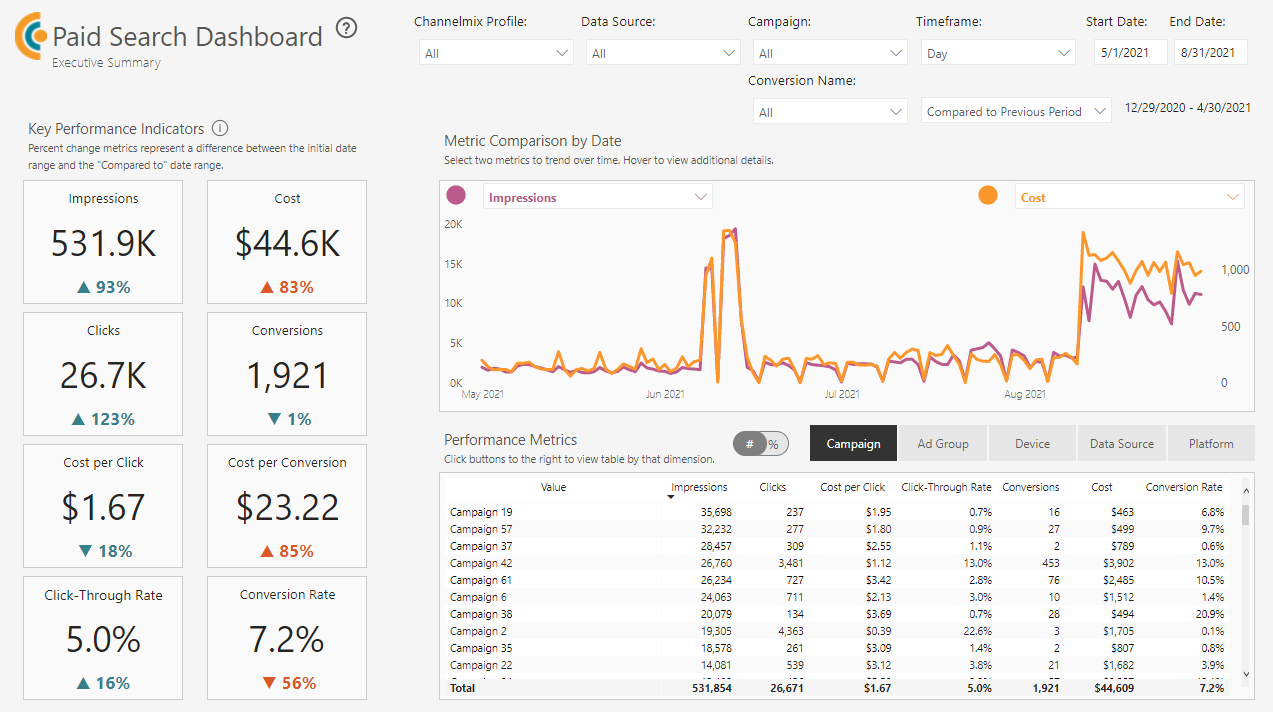
Analyst Tool
Comprehensive key performance indicators, with dynamic user filters and metric comparisons

Industry Dashboards
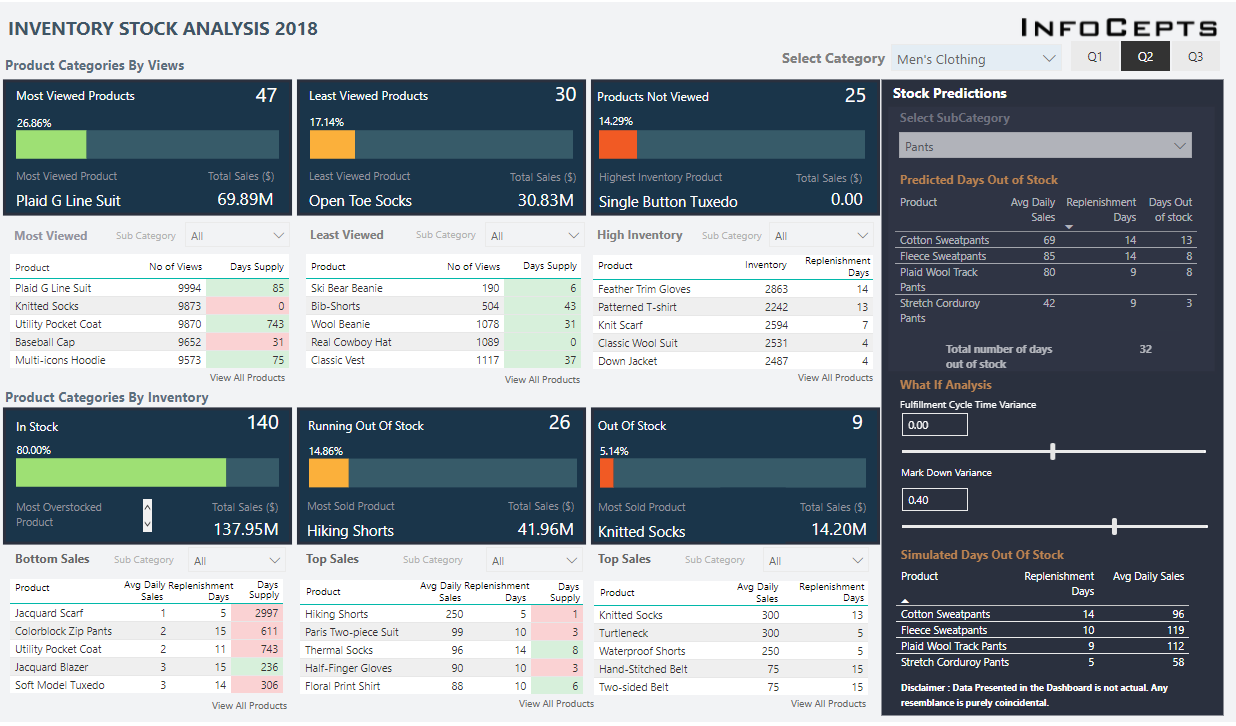
“What If” Analysis
Descriptive and predictive analytics, allowing the user to generate simulated forecasts
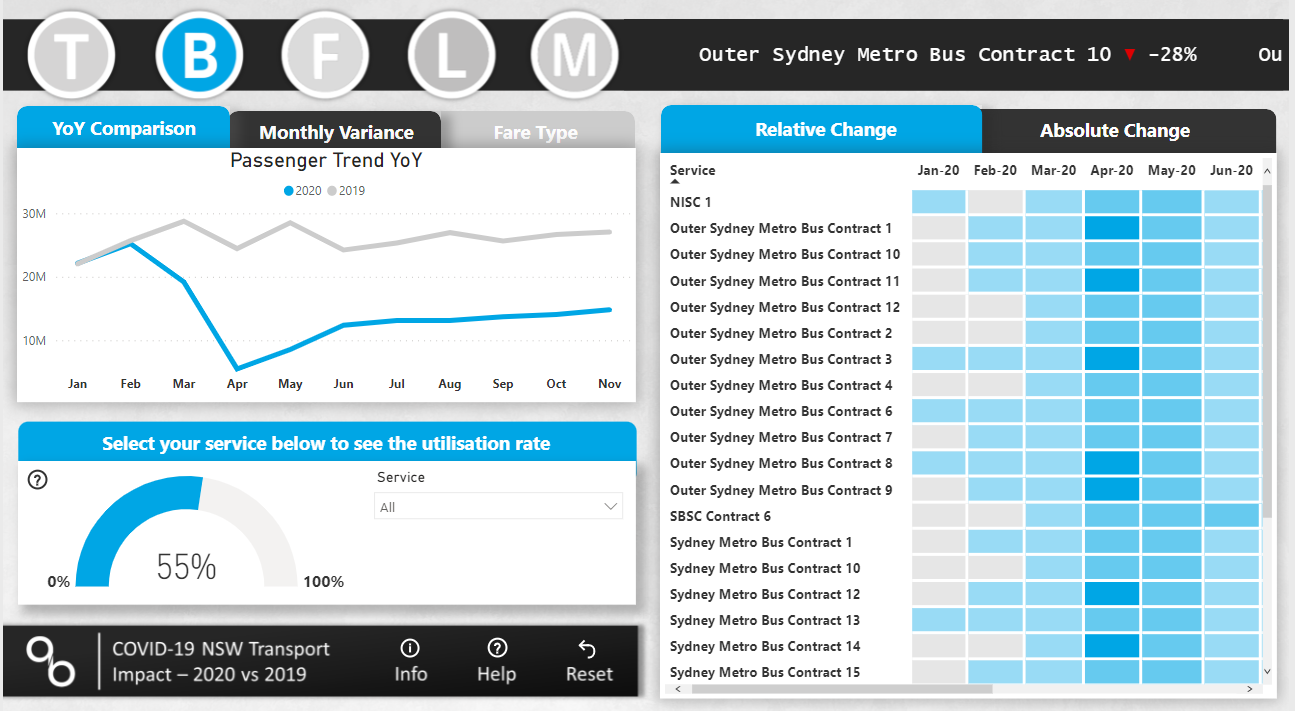
Dynamic User-Experience
Tiered navigation, menu bar (i.e., info, how-to, and reset buttons), custom metrics, and extensions
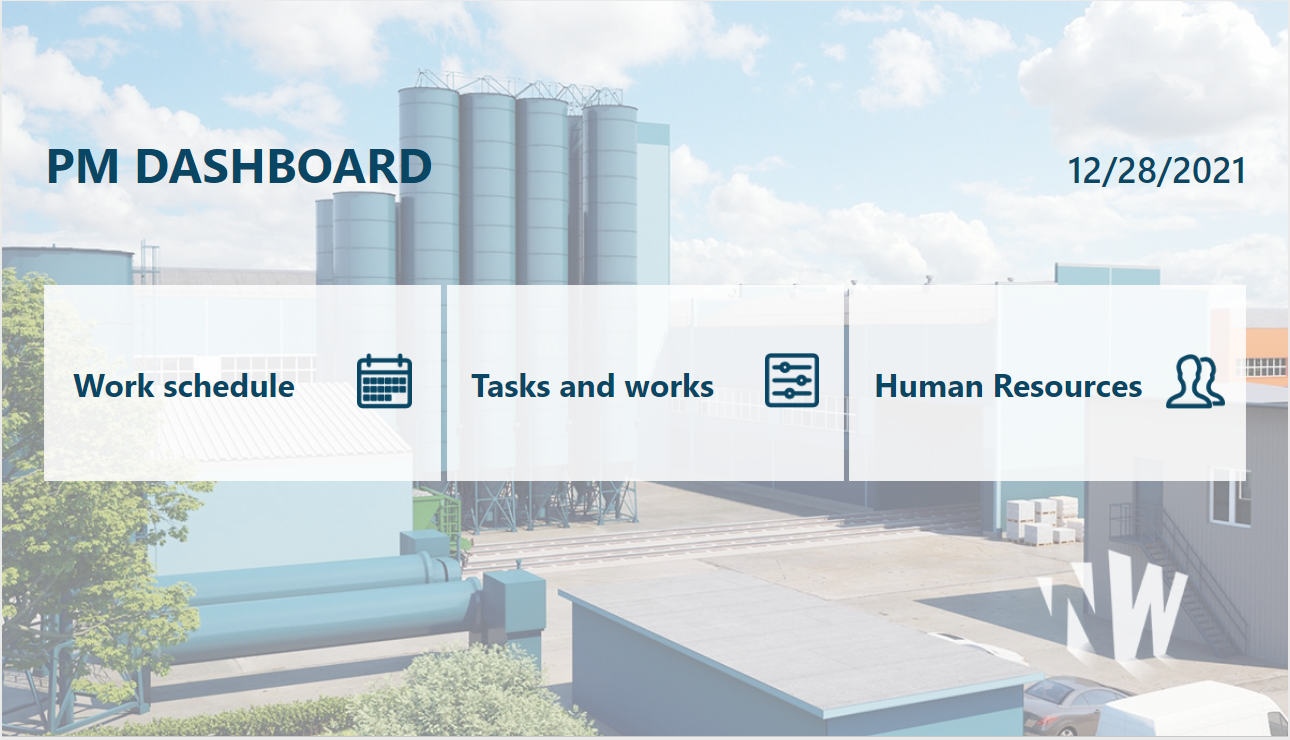
Modern User-Interface
Well-designed background, and menu, makes PowerBI feel more like a custom solution
Contact Us
We’d love to hear more about your business and how we can help.