
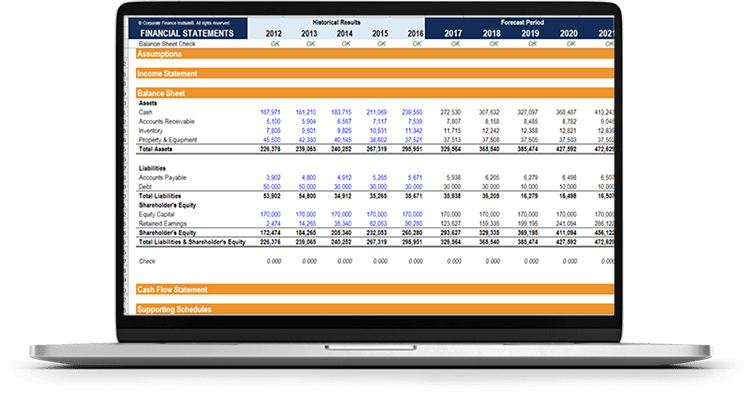
Custom Reports translate analytics into practical insight and support knowledgeable decisions to more quickly resolve issues and build upon successes. You’re able to tailor strategies to meet your specific target and generate turnkey reports that represent exactly what you want and need.
Benefits
- There are no limits to the data or how it’s presented.
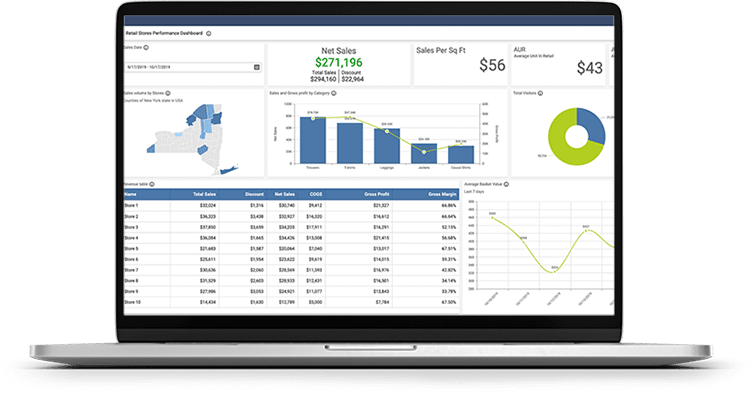
Custom Dashboards provide visibility through self-activated information sharing. The right dashboard includes success indicators, pinpoints areas that require adjustment, and encourages profit and time-savings. You’ll have the story of what happened, what might happen, and what should happen next – all on one screen.
Benefits
- Real-time data/intelligence coming from all of your data sources, that can be seen, understood, and acted upon quickly and with confidence.
- Sound decision making.
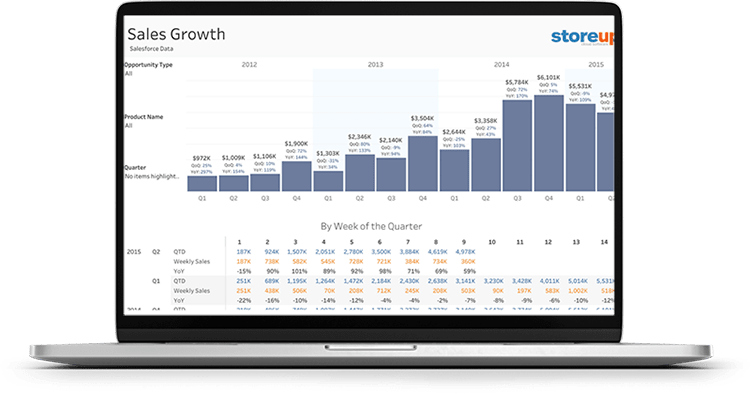
Visualizations are the graphical representation of information and data. Charts, graphs, maps, tables, and data visualization tools customize the look of the dashboard/report and allow for quick comprehension of patterns, trends, and outliers. Controller elements, filters, and hover-over effects ensure reports that are attention-grabbing, insightful, and interactive. In the world of Big Data, custom visualization tools and technologies are essential to analyzing massive amounts of information and making data-driven decisions.
Benefits
- Grabs interest and keeps all eyes on the message.
- Able to quickly see trends and outliers and internalize them quickly.
- Storytelling with a purpose.
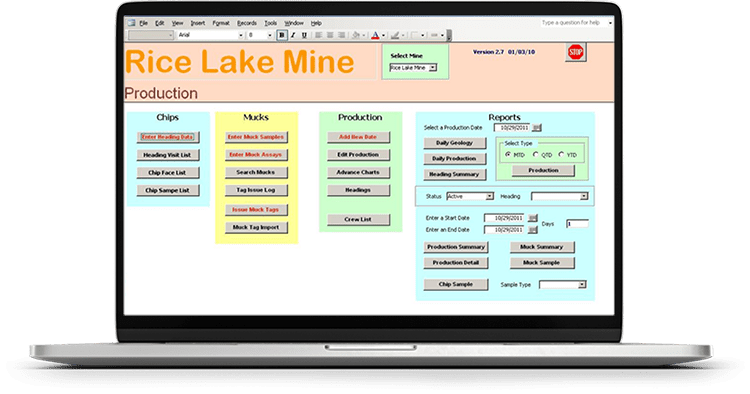
Custom Applications are engineered around specific operations and integrate data from multiple sources into a DLW to provide more efficient processes and superior analysis. Most of our applications are report-driven. Going beyond reporting, applications can automatically transfer data from one database to another, export and manipulate it, and so much more.
Benefits
- Increased efficiency and effectiveness that comes from custom-designed and developed solutions to fit your business processes
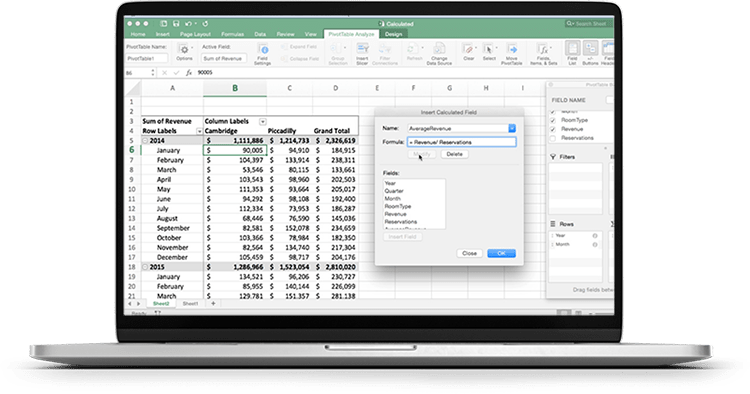
Data Views allow you to easily look at all of the data in a data warehouse. Similar to Excel spreadsheets, Data Views allow you to see the raw data as it’s stored in the spreadsheet, as part of a larger database that’s stored on the shelf of the data warehouse. Four powerful methods to analyze data include roll-up, drill-down, slice and dice, and pivot (rotate).
Benefits
- Reduce or eliminate the use of Excel for repetitive data-related tasks and projects.
- Save time by quickly and easily viewing and changing small chunks of data from multiple data sources at the same time, without having to print reports or export data from multiple programs.
- Analyze and clean up your data on a regular basis.
- Look at multiple databases at the same time.
- Gain real-time visibility to your data, allowing you to gain insights that would not otherwise be possible.
- Prepare your data to be used in reports, dashboards, visualizations, and applications.